
To borrow a term from Alan Greenspan's classic playbook of words, consider the following "conundrum." Financial research firm Dalbar, Inc. reported that the compound annual growth rate (CAGR) of the S&P 500 over the last 20 years was just shy of 12%. Such a growth rate would almost double the value of a portfolio every six years, so shouldn't we expect to see the average stock investor jumping for joy? Surprisingly, there's little joy in mutual fund investor Mudville. When Dalbar's researchers probed deeper, they discovered that the average equity-fund investor actually realized a CAGR below 4% over the same 20-year period—less than one-third the market average. How could investors' actual returns be so much lower than the returns of the market in which they were likely invested? While the usual suspects might include somewhat sub-par investment management, management fees and other expenses, it turns out these don't explain the paradox.
"What we've got here," as Captain in the movie classic Cool Hand Luke said, "is [a] failure to communicate." Specifically, the commonly reported statistics for tracking fund performance often fail to communicate an accurate picture of the returns actually achieved by investors. Traditionally, investors have relied on the published total return of a fund as their measure of performance. While this statistic is useful, the problem with relying on it exclusively is that total return is a time-weighted measure, which is computed by effectively assuming that investors deposit money at the beginning of the performance period and pursue a buy-and-hold strategy--that is, they do not add or withdraw any funds during the relevant period.[1] While such a buy-and-hold strategy is applicable to some investors, it is not the case for many others.[2]
Weighting Returns.
When was the last time you checked your quarterly Portfolio Performance Report from J.V. Bruni and Company? Did you notice that we report two rates of return—a time-weighted return and an internal rate of return (IRR)?[3] We've reported both of these numbers to our clients since the company's inception. For most clients, these two percentages are usually close in value. Naturally, given the similarity of these numbers, it may seem logical to conclude that these two performance measures are merely similar ways of calculating the same thing. This conclusion would be wrong, and it's important to recognize the difference between these measures of return when evaluating your portfolio management as well as your portfolio performance.
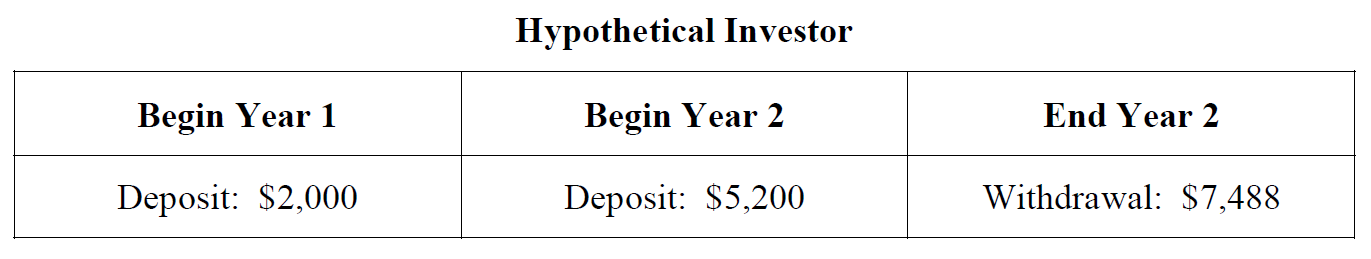
How does an IRR differ from a time-weighted return, and which measure is most relevant for the investor? A simple example might help clarify the difference between these two measures. Let's suppose an investor purchased 100 shares of an equity mutual fund for $20 per share for a total initial investment of $2,000. Assume that during the first year the fund's price rose by 30% to $26—a strong year. At the beginning of Year 2, the investor purchased an additional 200 shares at $26 per share, investing another $5,200. During Year 2 the price fell by 4% to end the year at $24.96—a poor year. Assume this investor cashed out at the end of Year 2, selling all 300 shares for $7,488. The table below summarizes the timing and magnitude of the investor's deposits and withdrawals.
Evaluating the Fund Manager.
How well was this hypothetical mutual fund being managed? What's an appropriate measure of the fund manager's performance over this two-year period? In this case, the fund's price rose by 30% during the first year, then fell by 4% in Year 2. The price rose by almost 25% over the two-year period, so it grew at an average of 11.7% per year.[4] Thus, the fund's annualized total return is just shy of 12% per year, presumably reflecting the manager's stock-picking ability. This time-weighted rate of return measures the fund manager's performance reasonably well, because it essentially focuses on the stocks within the portfolio. It ignores variables outside the manager's control—for example, the timing and magnitude of investor deposits and withdrawals.
Actual Investor Return.
However, our hypothetical investor's actual portfolio did not fare so well. Computing a dollar-weighted return (another term for IRR), we find that the investor only earned a CAGR of 3.1%, well below the time-weighted return of 11.7% over this same period. Why is there such a large gap between the time-weighted and dollar-weighted measures? In essence, after witnessing the fund's exceptional Year 1 return of 30%, the investor bought high by making a large deposit. He thus had more than twice as much money invested when Year 2's return plummeted. Frustrated with dismal Year 2 performance, he cashed out—basically selling low. Since dollar-weighted rates of return place more weight on periods when more assets are invested, the poor return of Year 2 was weighted heavily enough to drag the investor's two-year average annual performance down substantially. As you can see, the IRR incorporates the timing and magnitude of deposits and withdrawals--variables that are controlled by the investor, not the investment manager. Thus the IRR measures the actual return achieved by the investor, and it is the result of both the fund manager's investment decisions and the timing and magnitude of the investor's deposits and withdrawals.[5]
Paradox Explained.
Similar to our hypothetical investor, self-styled market timers often buy high and sell low, with the resulting heavier dollar-weight in downturn periods. Researchers have concluded that one of the primary reasons for the large gap between the time-weighted total return and the dollar-weighted IRR for mutual fund investors is that they have tended to chase hot funds—buying high and selling low, a formula destined for failure. Poor market timing is therefore a very plausible explanation for the large gap reported by Dalbar, Inc.
Two to Tango.
Since investors are primarily motivated by the prospect of growing their nest egg, it's imperative that both time-weighted and dollar-weighted return measures be used to correctly gauge performance. While mutual fund performance reporting has been around for many years, research firm Morningstar Inc. recently began reporting not only the usual total time-weighted return for each fund in its database, but also each fund's IRR. Morningstar refers to this new performance measure as the "Morningstar Investor Return"—a dollar-weighted internal rate of return that captures the impact of deposits and withdrawals.
With this new data, Morningstar compared the total return and the dollar-weighted return (or "Investor Return") across the funds it tracks. While generally smaller than the gap reported by Dalbar, the Morningstar results are consistent with Dalbar's. Summarizing, Morningstar stated, "In aggregate, the data show that investor returns [dollar-weighted] have generally lagged those of funds' published total returns [time-weighted]." As an example, over the last 10 years, Morningstar reported that diversified stock funds generated average total returns of 8.8% a year, while the dollar-weighted average was 7.3%, indicating that the typical diversified stock fund investor realized only about 83% of the stated total return. One of the largest gaps of the past decade occurred in technology sector funds,[6] which generated a time-weighted CAGR of 6.4%, while the average tech-sector investor actually experienced a loss of 4.2%.
Closer to Home.
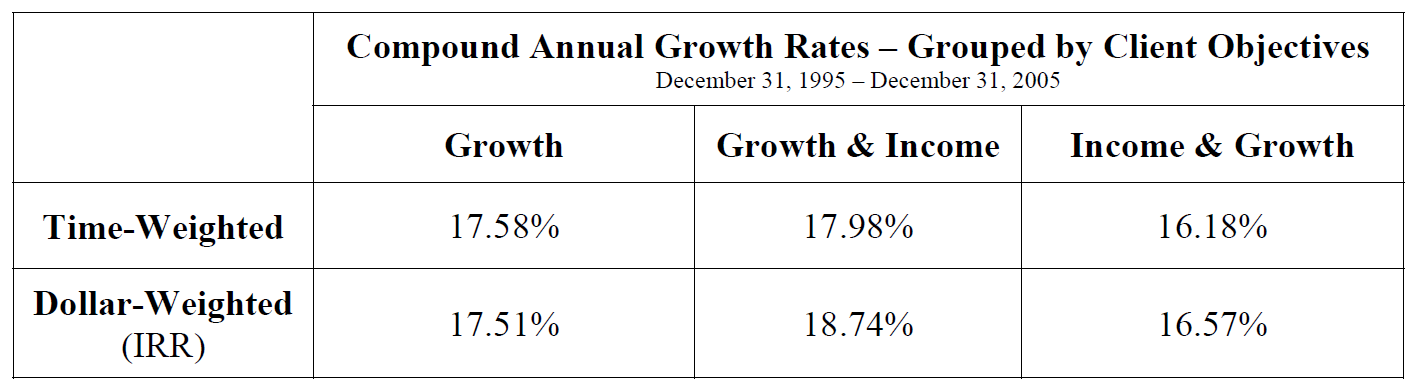
I examined the rates of return for clients who have been invested with J. V. Bruni and Company for the 10-year period from December 31, 1995 through December 31, 2005. The table below shows the average CAGR for each of our published composites--growth, growth and income, income and growth—depicting both the average time-weighted and dollar-weighted rates of return.[7] The big gap between time-weighted and dollar-weighted returns observed for mutual fund investors is largely absent for our clients. What accounts for this smaller differential?
To answer this question, consider first a client who pursued a strict buy-and-hold strategy, investing funds on December 31, 1995 with no deposits or withdrawals over the next 10 years. For this investor, the dollar-weighted return would be exactly equal to the time-weighted rate of return.
To use a numerical example, let's return to our earlier case of the hypothetical mutual fund investor. Instead of chasing hot performance with greater deposits, what if the investor contributed $2,000 at the beginning of Year 1 and withdrew the fund balance at the end of Year 2, with no additions or withdrawals within the two-year period. In this situation, the time-weighted return remains unchanged at 11.7% CAGR. However, the dollar-weighted return (IRR) is now identical to the time-weighted return, because no adjustment for deposits or withdrawals is required. The initial $2,000 deposit at the beginning of Year 1 grew to $2,496 at the end of Year 2, thus generating just under 25% cumulative growth, an 11.7% CAGR.[8]
Since the internal rates of return for our clients tend to be very close to their time-weighted returns, this suggests that either few deposits or withdrawals occurred over the period, or the timing of flows was sufficiently random that the dollar-weights did not significantly skew the IRR above or below the time-weighted return. In all probability, flows in and out of most client portfolios occurred in a relatively unbiased manner, resulting in small gaps between the time-weighted and dollar-weighted returns.
Valuable Information.
How might clients use the two rates of return to evaluate their portfolio management and their portfolio performance? First, think of the time-weighted return as the performance that would have been achieved, had no deposits or withdrawals been made during the period--a buy-and-hold approach. Unlike considerable numbers of mutual fund investors, it appears that our clients have not attempted to time the market. That's good, because studies have shown that investors are typically unsuccessful at market timing and tend to buy near high points and sell near troughs. Our clients appear substantially more successful at curbing their emotions when witnessing stronger or weaker short-term market performance—and they have reaped the rewards of patience and discipline.
A buy-and-hold strategy will work fine when there is competent portfolio management. Given good portfolio management, a strategy of making deposits and withdrawals will also work, if these deposits and withdrawals are driven by factors other than emotional reactions to short-term market moves. As MIT economist and Nobel Laureate Paul Samuelson once advised, investing should be methodical, not a source of excitement—"If you want excitement," he said, "take $800 and go to Las Vegas."
1 When there are deposits and withdrawals, a time-weighted rate of return is calculated by computing the percentage return for each time interval between capital flows in or out of the fund and then mathematically linking each of these interval rates. The result is a rate of return equivalent to one computed for a buy-and-hold strategy.
2 When analysts or the media report that the S&P 500 has "grown at an average annual rate of 12% over the past 20 years," they are also quoting a time-weighted rate of return, which does not incorporate the impact of cash inflows or outflows.
3 For all except the current year, these net rates are annualized returns—that is, they represent percentage returns per 12-month period after all expenses (trading commissions and JVB management fees) have been paid.
4 The price grew from $20 at the beginning of Year 1 to $24.96 by the end of Year 2. Therefore, the cumulative percentage growth over the two-year period is 24.8%, which means the CAGR is about 11.7%. Using the compound growth formula, we have $20 x (1+ 0.117) x (1 + 0.117) = $24.96. Note that the investor's deposits and withdrawals are not involved in this time-weighted calculation.
5 Using statistical software in Microsoft Excel, we have IRR = IRR(-$2,000, -$5,200, $7,488) = 0.031, or 3.1%. For quantitatively-oriented clients, IRR is the rate of interest (or discount rate) that makes the net present value (NPV) of an investment equal zero. Mathematically,
NPV = 0 = -$2,000 - $5,200/(1+r) + $7,488/(1+r)2. The solution is r = 0.031.
6 Given the high-tech boom of the late 1990s, when many investors purchased technology growth funds shortly ahead of the peak in early 2000, perhaps the large gap is not surprising.
7 Rather than computing the average return on all dollars invested (which would have weighted large client accounts more heavily), I computed an average of individual client rates of return in each category--thus, each client's return was equally weighted, regardless of portfolio size.
8 That is, the investor's dollar gain ($496) generates almost 25% cumulative growth ($496/$2,000).